Neighborhood-Scale Air Data: Five Ways Cheap Sensors Are Rewriting Who Gets to Measure
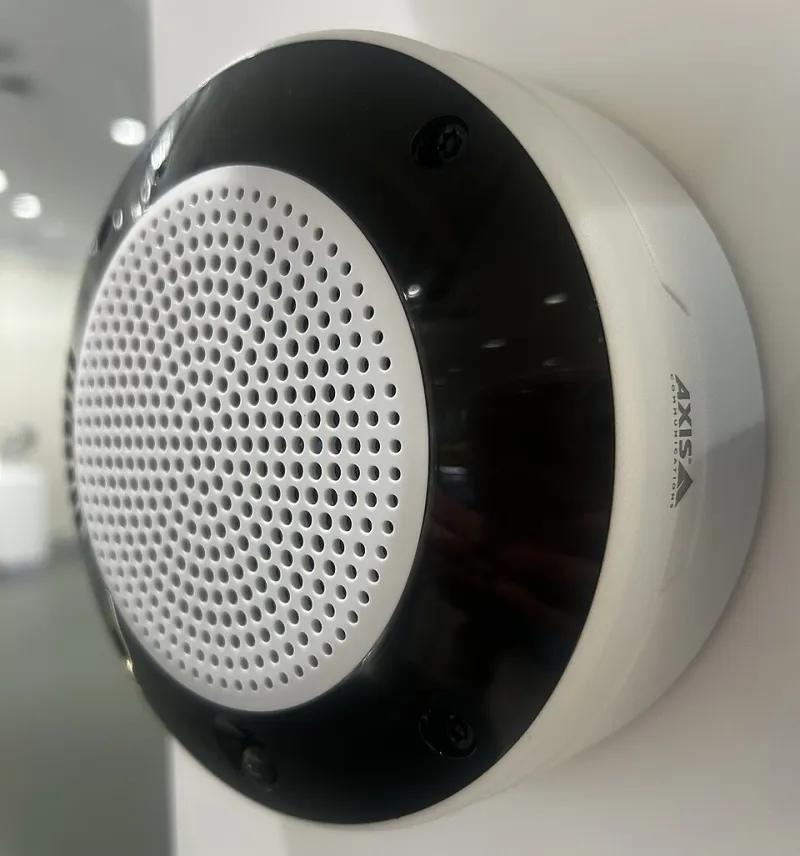
Photo: Lindiloue, CC0, via Wikimedia Commons
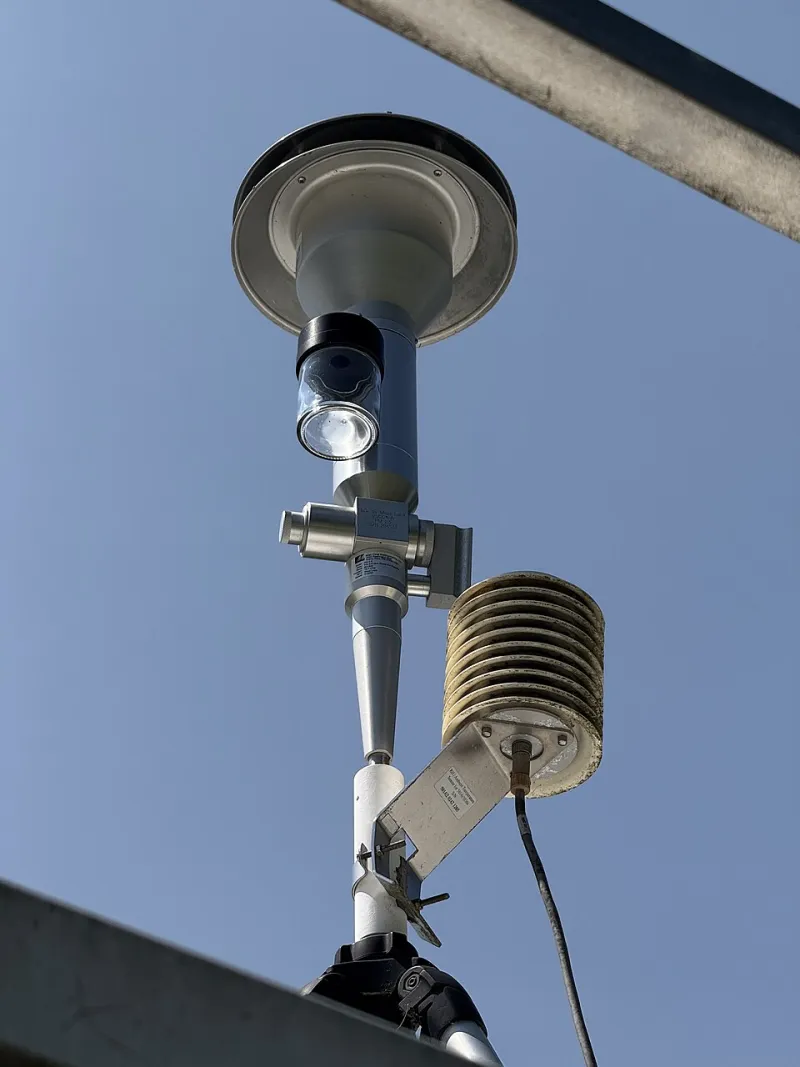
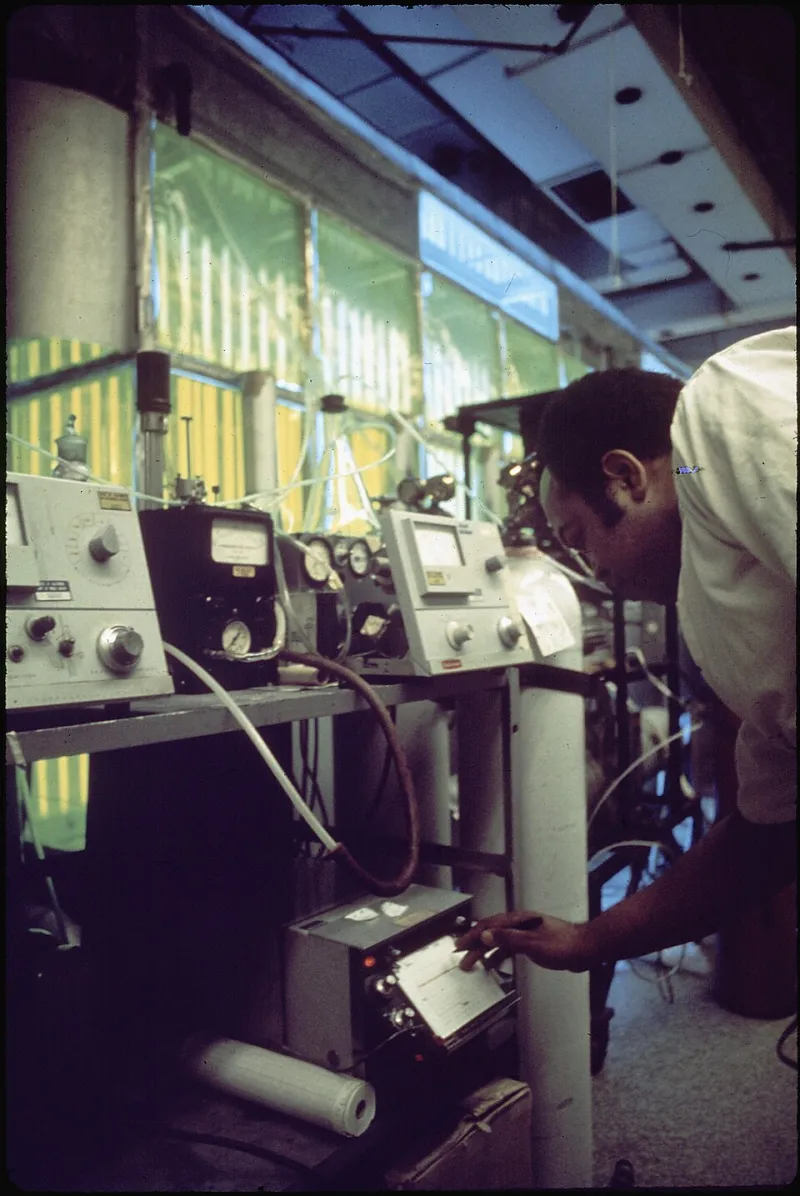
For most of the twentieth century, air quality data in the United States came from a small number of expensive, meticulously maintained regulatory monitors. The network was scientifically excellent and geographically sparse: a single FRM-grade station might stand in for a quarter-million residents, none of whom lived on its street corner.
That monopoly on measurement is ending. Optical particle counters, metal-oxide gas sensors, and low-cost laser scattering units — many priced between $100 and $300 — have enabled a proliferation of community-run networks that resolve air quality at the neighborhood, and sometimes the block, scale. The movement looks different in different regions, but its mechanics fall into a few recognizable patterns.
1. Wildfire Smoke Grids in the West
Nowhere has adoption moved faster than in fire country. In California, Oregon, and Washington, thousands of consumer-grade particulate monitors now form ad hoc smoke maps that update in real time during fire season. Residents in the Sierra foothills and the Willamette Valley use them to decide whether to run air purifiers, send kids to practice, or evacuate ahead of shifting plumes. County health departments increasingly ingest this hyperlocal data alongside PurpleAir-style networks to target alerts, since smoke concentrations can vary dramatically across a few miles of terrain.
2. School Districts Building Their Own Networks
Across the Sun Belt and beyond, school districts have begun mounting low-cost sensors on campus rooftops — partly for air quality, partly as STEM curriculum. Districts in Phoenix, Fresno, and Houston have used campus networks to time outdoor activities, justify filtration upgrades, and give students hands-on experience with the same data pipelines used by professionals. The educational payoff has proven as durable as the operational one: a generation of students learning to question, validate, and interpret environmental measurements.
3. Environmental Justice Mapping in Industrial Corridors
Community organizations in Louisiana's Cancer Alley, Port Town neighborhoods in Baltimore, and the industrial southwest side of Chicago have deployed dense sensor clusters to document exposure disparities that sparse regulatory networks never captured. These campaigns pair sensing with organizing: the data becomes the basis of petitions, permit comments, and litigation support. Because the stakes are legal and political, these groups tend to be the most rigorous about sensor siting, co-location, and quality control.
4. Municipal Heat and Pollution Surveys in the Midwest
Cities like Chicago, Minneapolis, and Detroit have embraced mobile sensing — sensors mounted on vehicles, bikes, and transit — to map urban heat islands and pollutant hotspots at a resolution fixed stations cannot match. Heat mapping campaigns, often run with volunteer drivers, have directly informed tree-planting priorities and cool-roof incentive programs. The same traverse methodology is now being applied to nitrogen dioxide and ultrafine particles along freight corridors.
5. Validation Pipelines That Make It Credible
The final and arguably most important development is methodological, not technological. Best practices have emerged for making low-cost data defensible: co-locating units with regulatory monitors for several weeks before deployment, applying region-specific correction factors for humidity and aerosol composition, flagging data during extreme smoke events when optical counters saturate, and publishing raw alongside corrected values. Federal evaluations — including EPA's ongoing performance testing of consumer sensors — have given buyers a rational basis for comparing devices.
The Honest Trade-Off
Low-cost sensors are not regulatory monitors, and treating them as such is a mistake. Particle sensors struggle to distinguish smoke from dust from pollen. Gas sensors drift, as any reader of this site knows well. Raw numbers from a $250 device should never appear in a compliance filing.
But that was never the point. The point is coverage, resolution, and participation — thousands of imperfect witnesses instead of a handful of perfect ones. Combined with disciplined validation, the aggregate picture these networks produce is something the old model could never offer: air quality data that belongs to the people breathing the air.