Paper Charts and Punch Tape: Inside America's Last Analog Monitoring Stations
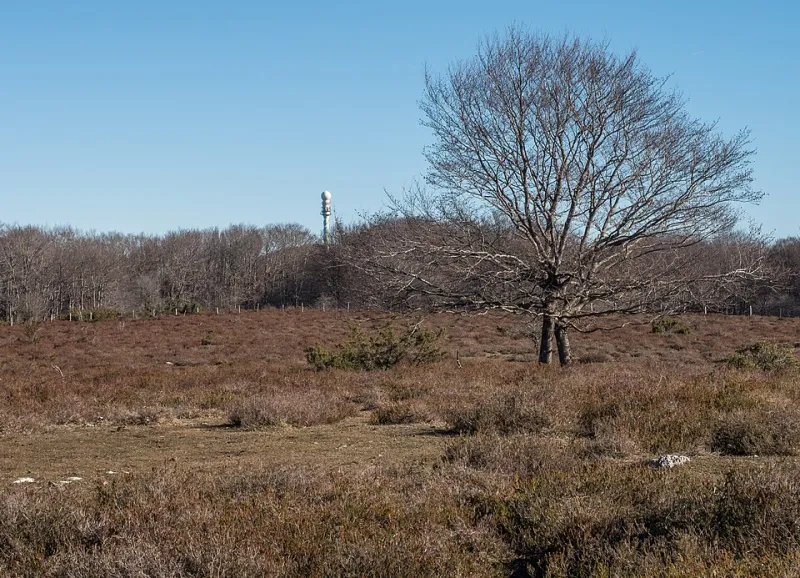
Photo: Basotxerri, CC BY-SA 4.0, via Wikimedia Commons
Somewhere in the American interior, a strip chart recorder is tracing a humidity line onto graph paper this minute. No firmware update is pending. No cellular modem is searching for signal. The pen moves, the drum turns, and by the time most station operators have finished their morning coffee, the day's data is already on paper — legible without a screen, a login, or a subscription.
It sounds like a museum piece. It is, in a handful of cases, still the working record of record.
The Last of the Chart Houses
The National Weather Service retired its final routine paper-chart operations at most cooperative stations decades ago, but analog instruments persist at the edges of the network: a few siphon rain gauges with float-driven pens, hygrothermographs in remote park service installations, and legacy air sampling setups where a drum recorder remains the primary or backup log. Some survive by inertia. Others survive on purpose.
Operators who maintain them describe a familiar set of reasons. The instrument works. The record is continuous. And nobody has ever had to reboot a mechanical recorder.
What Digital Networks Quietly Give Up
The modern monitoring stack is, on paper, strictly superior: higher sampling rates, real-time telemetry, automated quality control. But digitization introduced failure modes the analog era never had.
Power and connectivity gaps. A chart recorder keeps writing through a grid outage as long as its clockwork or mechanical drive keeps turning. A digital datalogger with a drained battery writes nothing, and what it missed is unrecoverable. After major storm events, the stations that produce complete records are sometimes the ones with no electronics to fail.
The silent dropout problem. Analog instruments fail visibly — a flatlined pen, a dried ink reservoir, a stopped drum. Digital failures are often invisible: a sensor that reports plausible-looking numbers, a logger that truncates without erroring. Field technicians who trained on chart recorders learned to read an instrument's health from its trace. That literacy, several veterans note, is thinning as the workforce ages.
Resolution without context. A one-minute digital average is precise, but it can smooth over exactly the kind of short-lived excursions — a gust front, a plume passage — that a fast-tracing pen captured as a visible spike. Some researchers reviewing historical analog archives argue the old charts preserve character that modern averaging discards.
The Case for Analog as Redundancy
There is a serious engineering argument here that goes beyond nostalgia. Critical infrastructure planning has rediscovered the value of non-electronic fallbacks: manual gauges at stream gauging stations, mechanical backups on aviation sensors, paper log sheets at water treatment plants. A chart recorder is a form of insurance with a century-long track record.
A few institutions have formalized the practice. Where regulatory or research requirements demand uninterrupted records, some facilities run digital and analog instruments in parallel, using the paper trace to audit gaps, verify spikes, and reconstruct events when the datalogger hiccups. The cost is modest; a recorder and a supply of charts run a small fraction of a research-grade sensor package.
The Maintenance Reality
Analog is not free of its own failure modes, and it would be dishonest to pretend otherwise. Pens clog. Charts jam. Clock drives drift and need calibration like any instrument. Reading a chart into a digital archive is labor-intensive, and transcription error is a real risk — one reason many historical paper records remain unconverted.
The talent pipeline is the deeper problem. Instrument literacy of the hands-on kind — knowing how a bourdon tube behaves, how to time a chart swap, how to spot a bearing going bad by the sound of the drum — is taught less every year. The holdout stations persist partly because a small number of people refuse to let the skill die.
What the Holdouts Teach the Digital Network
For most buyers and network operators, the takeaway is not to revert. It is to design for the failure modes digitization introduced:
- Budget for local buffering. Onboard storage sized for days, not hours, of data is the digital equivalent of a chart drum.
- Pair redundant systems with different physics. A mechanical rain gauge beside a tipping bucket tells you which one lied.
- Keep manual observation in the protocol. A human reading a stick gauge weekly catches drift that automated QC flags only in aggregate.
- Preserve the paper archive. Digitize old charts before the ink fades and the people who can interpret them retire.
Obsolete, or Just Independent?
The stations still drawing ink across paper are not a blueprint for the future of environmental monitoring. But they are a standing reminder that the newest system is not automatically the most reliable one, and that resilience sometimes lives in the technology we were quickest to retire. As climate volatility pushes more networks toward the edges of grid and connectivity, the humble chart recorder may look less like a relic — and more like a reference implementation of uptime.
EnvSens will continue tracking how operators balance digital throughput against analog endurance, one data point at a time.